

Looking Into Value And Returns For A Hotel Investment In The Indian Context
The Indian hospitality industry has recently recovered from a volatile downturn due to the country’s economic exposure to the world economy stated Kumar et. Al., 2009; Ministry of Finance, Government of India, 2016 and has witnessed a rapid supply expansion of inventory observed Cushman & Wakefield(2014). As a result, a major supply demand gap has occured, leading to a stressed financial environment, high cost of capital, weak credit risk management and poor performance indicators, leading to hotels being labelled as non performing assets opined Goyal and Verma (2017). In this study, we aim to conduct an assessment of financial returns for the development of a hypothetical hotel project in Gurgaon. We have conducted a demand-supply analysis of the Gurgaon hotel market using publicly available sources, and thereafter provided a 10 year forecast of the proposed development. On the basis of the projections, an IRR and NPV analysis has been conducted of the project to determine potential returns as stated by Griff (2014). With the help of such a study we aim to identify, what economic metrics are key to the performance of a hotel in this present scenario of the Indian hospitality industry. The study will be useful for investors, developers, hoteliers and revenue managers to assess the market.
INTRODUCTION
Within the real estate space, hotels as compared to other real estate classes can be considered a bit of anomaly state Burns and Novelli (2007). The reason being that other asset classes such as residential, retail and commercial properties are typically constructed by developers observed PWC (2016), keeping in mind that they can sell off floor space with the aim of generating returns . With respect to the hotel asset class this is not true, as not only does the investor have to deploy funds to construct the hotel, he also needs to invest towards managing it, either on his own or with a help of a management company.
The Historical Perspective
Prior to the 2008 global financial crises, the hospitality Industry was in a growth phase and room rates reached an all-time high (Graph 1). The overall share of the hospitality industry in the Indian economy’s GDP increased from 1.46% in 2004-05 to 1.69% in 2007-08, the share decreased to 1.45% in 2008-09. The average annual growth rate for hotels and restaurants was 8.8% in 2005-06, but registered a negative growth rate of -3.41% in 2008-09 and an insubstantial 2.2% growth in 2009-10 as reported by the Ministry of Finance, Government of India, 2011.
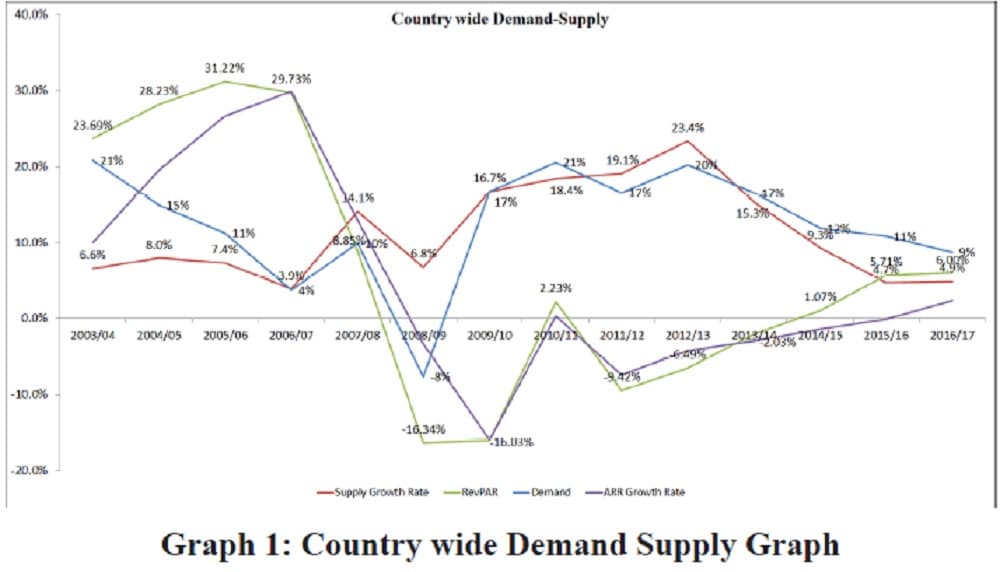
Graph 1: Country wide Demand Supply Graph
Revenue per Available Room (RevPAR) growth was at an all time high in 2005-06, with a growth rate of 31.2% year on year and 29.7% year on year in 2006-07. The 2008 financial crisis had a drastic impact on hotels, with a slowdown in travel, demand fell to 4% year on year in 2006-07 over the already reducing demand of 2005-06 and further to -8% in 2008-09, the negative growth rate was a clear sign of a recession in the industry. As a result of the thinning of hotel demand, average room rates dropped drastically, going down to -3.34%% in 2008-09 from 12.9% in 2007-08 and reaching an all-time low of -15.9% in 2009-10.
The inverse relationship between supply and RevPAR is clearly visible in Graph 1. As the supply growth rate started to decrease from 2012-13 onwards, RevPAR started to recover even though demand continued to grow at a lower rate year on year expounded Moore, (1925); Musonera and Ndagijimana, (2016).
Despite the crash in 2007-08, supply continued to witness large scale growth by 2012-13 supply having grown nearly 23.4% year on year; which can be attributed to investment that was already in motion before 2008. Most of this supply was planned prior to the economic crash, when rates were at an all time high. It was during this period that real estate developers started to take interest in the hotel asset class, looking at the high RevPAR’s there was keen investment in development of hotels. Interesting to note is, that the number of projects planned increased significantly. Infact as of 2007-08 the total proposed supply for the country as per HVS (2017) was 1,14,466 rooms, this has more than halved in 2016-17 coming down to 47,067 rooms.
2016-17 marks a new business cycle, with RevPAR’s recovering and showing positive growth. However the question to be asked here is whether investors have learnt their lesson and were they keeping in mind market conditions at all. The Indian hospitality industry is far more evolved than it was 20 years back. With this study, we aim to highlight what some of the parameters are, that a developer should keep in mind when investing into hotels as a real estate asset.
Trends
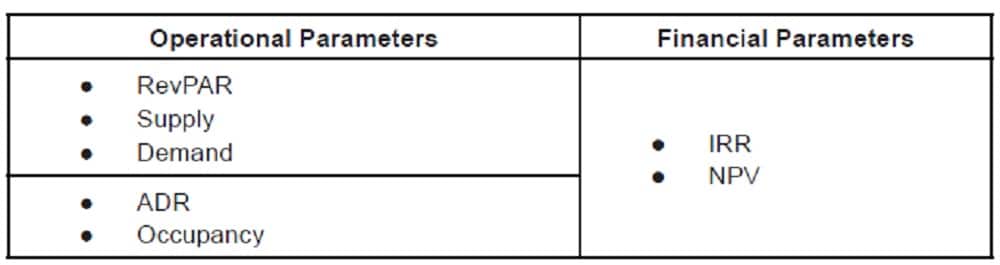
Based on the historic trends some of the obvious parameters that are tracked in the hospitality industry are RevPar, Supply and Demand. These above parameters are indicative of the overall strength or performance of a market, from an operations perspective stated Srivastava and Maitra (2016). In addition to these, we would like to add two more parameters which are used in the derivation of the above factors. They are occupancy and average daily rate (ADR). As a hotel is an income yielding asset, it would be fair to assume certain financial parameters for which investors could undertake financial risk. These parameters would include the Internal Rate of Return (IRR) and Net Present Value (NPV).
To highlight the strength of these parameters; for this study we have taken the perspective of a feasibility assessment of a hypothetical investment in Gurugram.
Feasibility
A feasibility study for a hotel is typically conducted with an IRR or NPV analysis.
- IRR – Typically in an assessment of a project, the highest IRR should be the project taken up by the investor established Atrill and McLaney (2011).
- NPV . If the NPV is positive then the project should be taken, if negative it should be avoided propounded Atrill and McLaney (2011).
Overview of Gurugram
Gurugram makes for an interesting case, as it has been known as the hub of business process outsourcing, knowledge process outsourcing, Fortune 500 and technology based companies, observed Joshi (2008), thus making it highly sensitive to economic downturns. With an increasing flow of corporations, the flow of business travellers also started coming to Gurugram opined McGinnis, (2012), creating a demand for business hotels. In 2015-16, 68% of all visitors were business travellers, MICE (meetings, incentives, convention and exhibitions) travellers constituted 14% followed by foreign inbound tourists (FITs) at 11%.
[Insert Pie Chart 1. Share of Various Travellers in Gurugram]
Forecasting
For the IRR and NPV analysis, a 10 year forecast would be required to assess a hypothetical investment. In order to do so, we would require a forecast to prepare the operational parameters mentioned above. Therefore, further understandings of the following parameters are required as
explained byMiller and Hayes (2010):
- RevPAR – Total Revenue/ Number of Available Rooms or Occupancy
* ADR - Supply Total Number of Rooms Available in the Market
- Demand – Total Room Night Demand or Room Nights Occupied in
the Market - ADR – Total Revenue / Total Number of Rooms Occupied
- Occupancy -Total Number of Rooms Occupied / Total Number of Rooms Available
Of the above parameters, the key parameters required for the forecast would be Supply, Demand and ADR. RevPAR and Occupany is derived from these three factors.
A Historical Performance of Gurugram
The supply of rooms spiked by 65.1% in 2009-10 and then stabilised for three years at an average of 17% (Graph 2). After slow growth over the last four years, the Gurgaon hotel market is showing signs of recovery, as new investment are being focused on developing Tier 2 and 3 cities across India observed Taneja (2016). RevPAR growth rate has been showing a positive trajectory since the last four years, as hotel rates increase along with occupancy levels, while the supply growth has slowed down (Graph 2).
Hotels are finally starting to reach a point of equilibrium where demand, supply and rates are in sync with each other. As the hotel market touches a positive position, there is opportunity to take advantage of increasing demand from both the corporate and MICE segment of travelers. Slowed supply growth is also an opportunity for existing hotels to take advantage of diminishing supply and increase their room rates further reported HVS (2017).
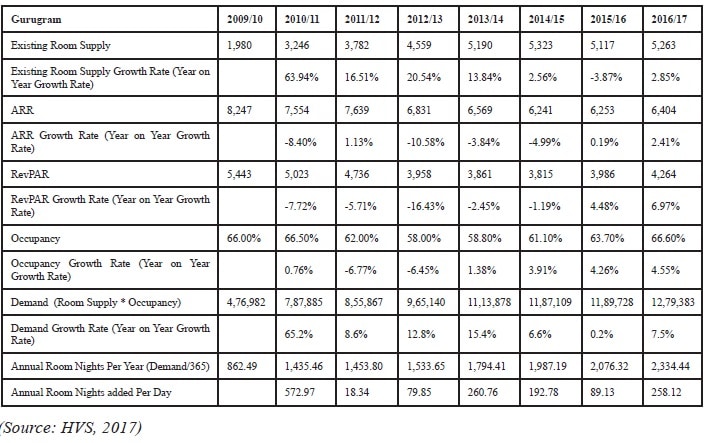
Given the above historical performance, we would use the latest year of 2016-17 as the base year for our projections. The base year represents the year upon which all forecasts would be made, i.e. based on the number in 2016-17 we would provide a forecast into the future.
The Market Forecast
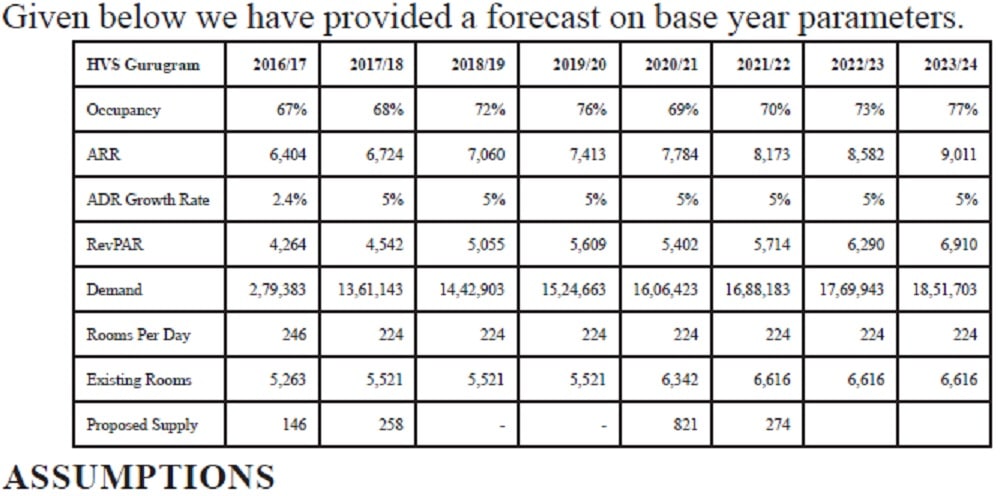
ASSUMPTIONS
- ADR forecast – The average daily room rates grew by 5% reported Inflation (2016), given that this is the level of inflation the country witnessed in 2016-17.
- Demand . Forecast demand by looking at the historic average room nights per day added into the city.
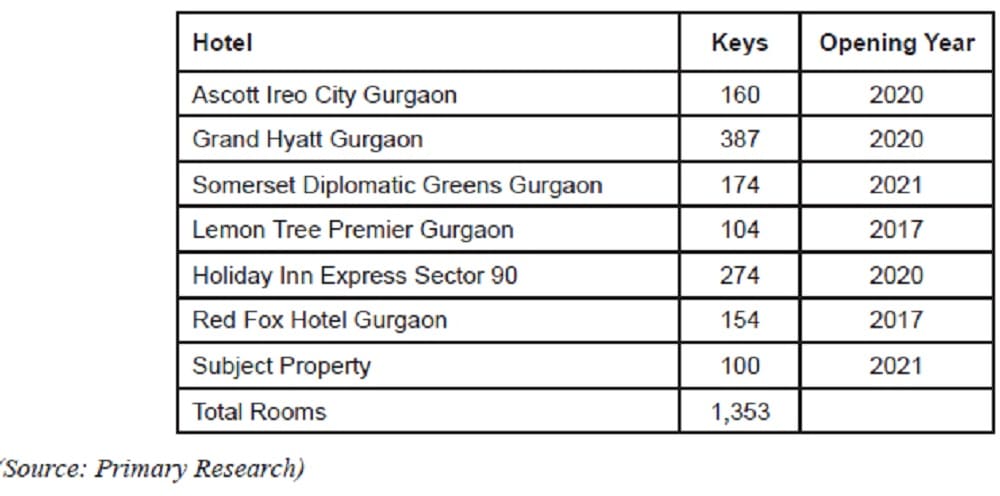
- Existing Rooms – By assessing the status of hotel projects and by when they would enter the market we have inputted the number year to year. This would include the hypothetical proposed subject property as well.
The above forecast maybe taken in pure nominal terms (as inflation is utilized) and it is not an accurate assumption of a forecast for revenue and budgeting; and is purely being used to conduct a financial analysis of an investment.
Property Forecasting
Based on the market forecast, a property forecast is to be conducted To do so we would be utilizing two new concepts, which are termed as the market penetration Index (MPI) and average rate index (ARI) as per Miller & Hayes (2010),
- Market Penetration Index
In this the hotel’s occupancy is measured against the average occupancy of the competitive set. It is calculated as follows:
MPI = Hotel Occupancy/Market Occupancy
Eg-1: Assuming that the hotel occupancy is 62% and the average market occupancy is 59%. The MPI for said hotel is:
70%/60% = 1.17 or 117%
The hotel is said to be doing above its fair share when MPI is greater than 1, if less than 1 it is doing less than its fair share. Hence, in this example itis doing more than its fair share. This implies that it is able capture demand that would otherwise go to another hotel in the competitive set.
- Average Penetration Index
ARI = Average Rate of the Hotel/Market Average
Eg-1: Assuming that the hotel average room rate is 8,000 and the average room rate is 10,000. The MPI for the said hotel is:
8,000/10,000= 0.8 or 80%
Similar to the MPI as a concept, if the API is below 1, then the property is below par compared to that of the market, if it equal to 1 then it as on par with the market, while if it is above 1; then it can be said to be performing above the market average.
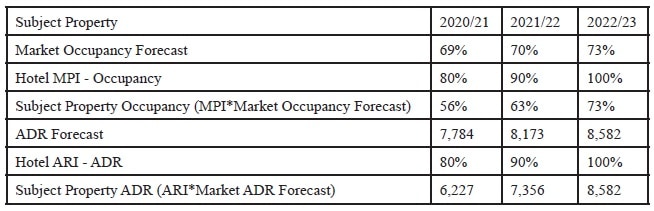
Hotel operations are expected to stabilize in 3 to 4 years, during the first two years, the hotel typically performs below market norms. In the above forecast we have assumed by the 3rd year, the hotel would perform on par with the market, and during the first two years would perform below the market as observed by OfNeill, (2011).
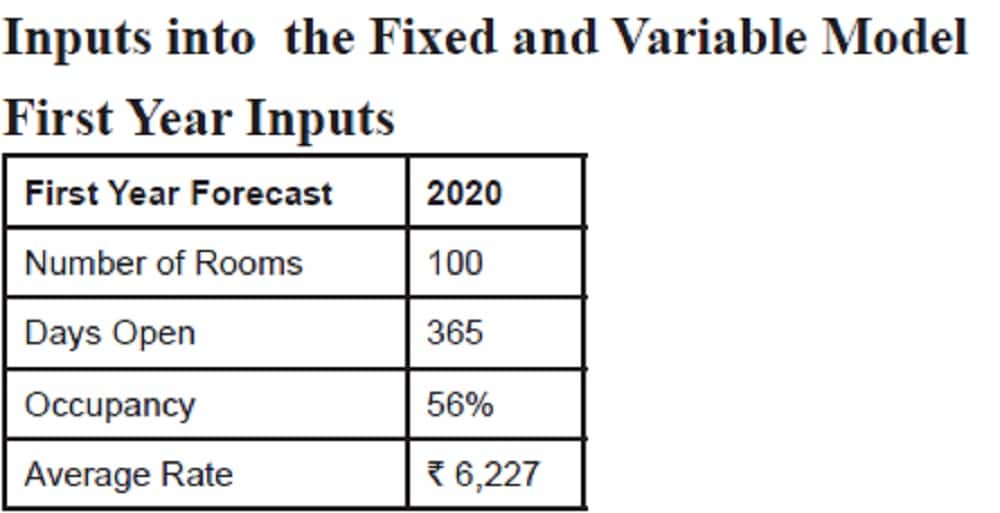
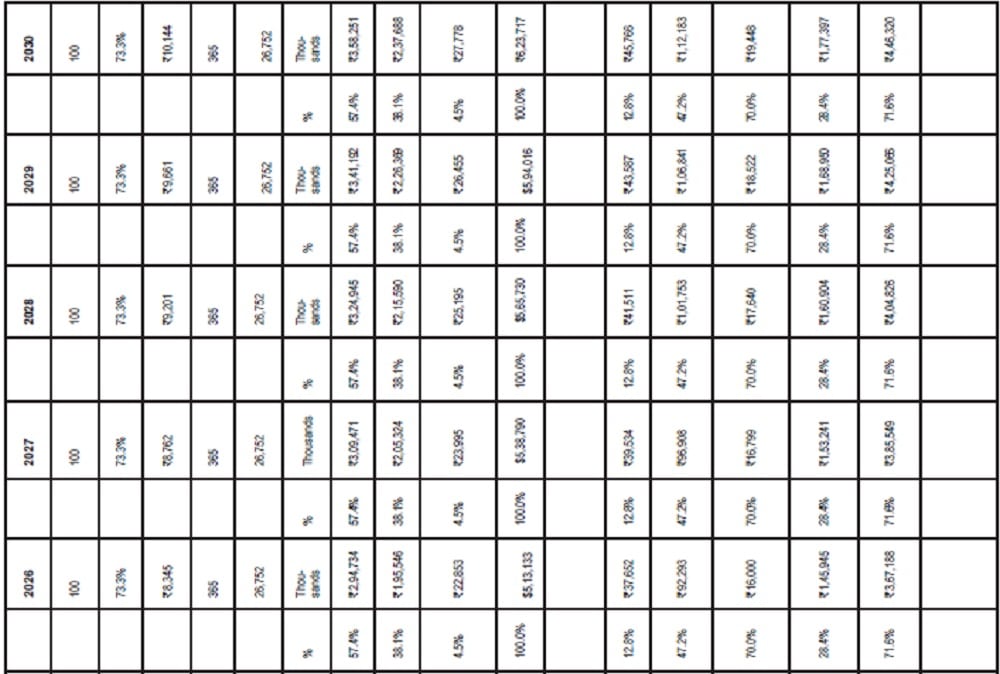
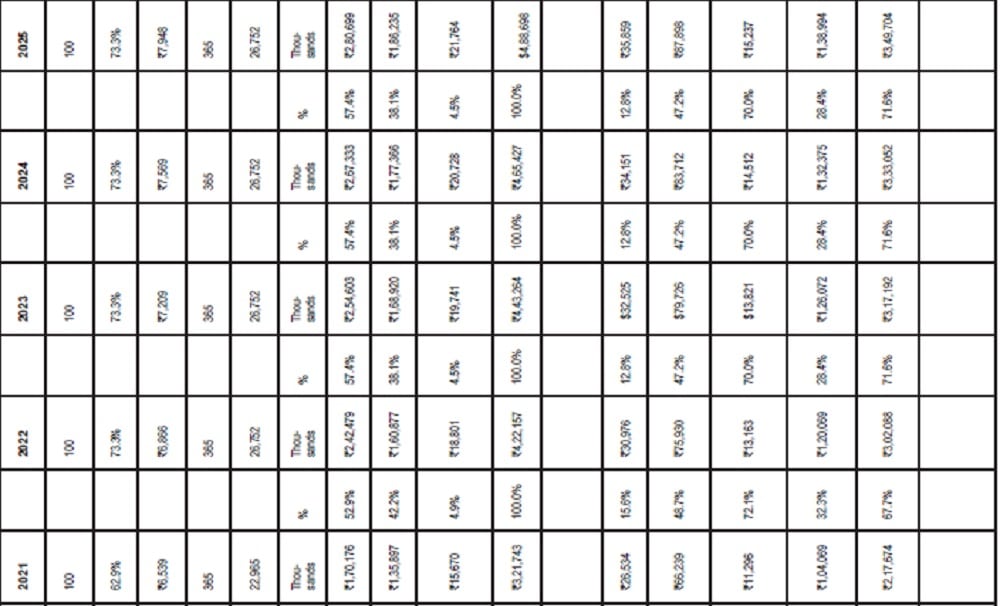
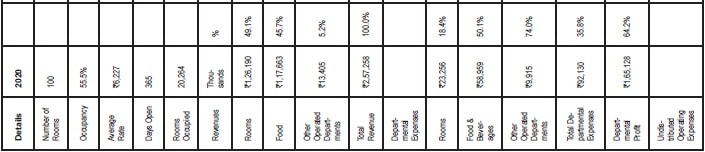
The Profit & Loss Statement Forecasting
Having derived occupancy and ADR for the property, room revenues can be derived with ease. Simultaneously, other assumptions would be made based on these two indicators alone. For the ease of this study, we have utilized the Fixed and Variable excel model; which is a component of the Hospitality Valuation Software (5th Edition), prepared by Professor Jan A. DeRoos, Ph.D. at Cornell University and Mr. Stephen Rushmore, Founder of HVS International (2017). This software is freely available for users.
While the Hospitality Valuation Software is a highly detailed analytical tool, we have only utilized the Fixed and Variable components for our forecast, as it is an ideal tool for the forecasting of profit and loss statements. The Hospitality Valuation Software is also designed for the valuation of a hotel asset in the North Americanregion; therefore we have made some changes to the excel model to make it more tailored to the Indian context. Furthermore, this study is for a feasibility assessment and not a valuation for which the software is ideally designed.
In order to gauge the understanding of the fixed and variable model, it is important to understand two concepts propounded by Harris and Mongiello (2006)
- Per Occupied Room (POR): Certain costs in a hotel are linked to occupancy, such as room revenue, food and beverage (Room Service, Restaurant Revenue), and minor operating departments (Travel Desk, Laundry, Spa, etc)
- Per Available Room (PAR): Certain costs are calculated on a Per Available Room, such as administration and general, marketing, utilities, repairs and maintenance. These costs are distributed throughout the hotel and occur irrespective of occupancy.
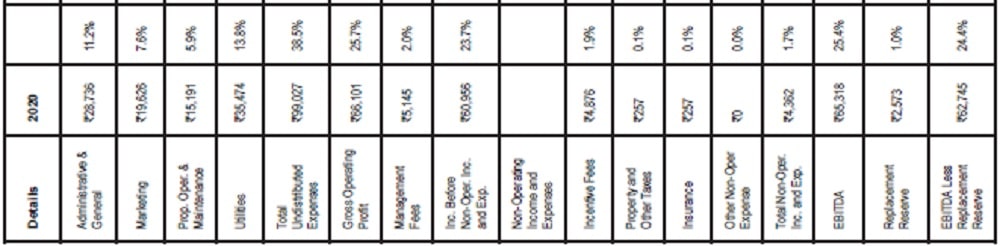
It would be appropriate to mention that the the Profit and Loss Statement prepared would be based on the Universal System of Hotel Accounting (“USHA”). Developed by the American Hotel & Lodging Association, this is the most wide spread format of presenting financial statements for any hotel or a similar establishment that provides accommodation to travellers. Under this format, revenue and expenses are divided department wise, to find out the income generated by each department individually.
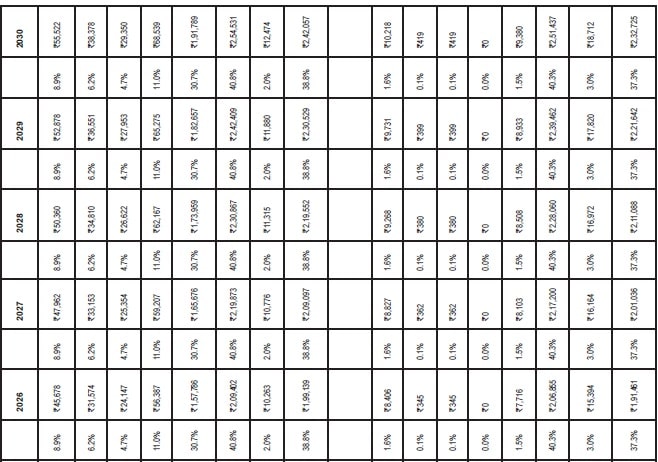
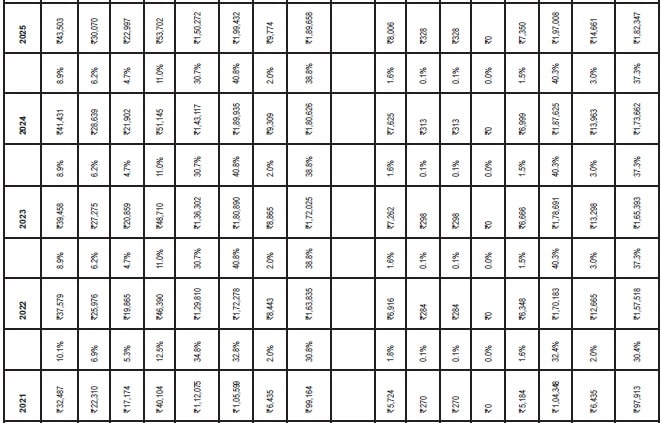
Undistributed operating expenses, such as administration, sales and marketing and utilities are then subtracted from total income to calculate the Gross Operating Profit (GOP). In situations where a hotel is managed by another company, the management fee as per the terms of agreement is then subtracted from the GOP, giving use Income before Non-Operating Income and Expenses.
Non-operating expenses like incentive fees, property taxes and insurance are subtracted from the GOP to achieve Earnings before Interest, Taxes, Depreciation and Amortisation (EBITDA). Interest, depreciation and amortisation and subtracted from EBITDA to find out Net Profit before Tax (PBT). In the last step, income tax is subtracted to achieve Net Profit (PAT).
The last time USALI was updated was in 2013, when its 11th edition was released at the HFTP Annual Convention (2013). This edition was implemented from 2015 onwards. Before that, the 10th edition was released in 2008 as reported by Hospitality Net (2008). The latest update was necessary to keep up with industry practices related to technological changes, implementation of sustainable practices, changing distribution channels, globalisation and improved ration analysis. Revising the USALI was also necessary to keep pace with the changes in International Financial Reporting Standards (IFRS) and the Generally Accepted Accounting Principles (GAAP).
In India, it is to be noted that for a majority of home grown domestic brands such as Taj Hotels, ITC and Oberoi’s the India Generally Accepted Accounting Principles are still utilized, while the newer foreign brands utilize USHA.
Adjustments to the Fixed and Variable Model
For the Indian context as per JLL (2014), we have made adjustments to the model to include two required inputs, which are
- Management Fees . Most Hotels in India are operated through management contracts, wherein the hotel is managed by a Hotel Management Company or operator. The operator charges the owner a fee for the management of the hotel. This is opposed to the Franchise agreement, where a hotel is managed by the owner and a franchise fee is charged by the Hotel Company for usage of its branding, standard operating procedures and so on.
- Incentive Fee . Management Contracts include an incentive fee for performance by the Management Company, Based on the performance of the hotel, an incentive fee is charged which is linked to the Gross Operating Profit of the hotel. Depending on variable levels of GOP the incentive fee would vary. There is however a minimum threshold level for the brand to operate at.
Revenue and Cost Estimates
In this study POR and PAR for Gurgaon market were taken from the Annual Publication known as the Federation of Hotel and Restaurant Association of India Indian Hotel Industry Survey(FHRAI, 2016). They were increased by the rate of inflation at 5% as the numbers available were for 2016.
A Management fee is fixed at 2% of gross revenue, while incentive fee is fixed at 8% of the gross operating profit as reported by JLL (2014). Property, other taxes and insurance are set at 0.1%, while reserves stabilise at 3% of the total revenue.
Cost of Construction
Given below are four varying costs of construction, for varied scales of development. Keep in mind these cost do not include cost of land, which is a key input for any real estate development. Due to a lack of transparency in the Indian real estate sector, we have not taken any land cost comparable. However most real estate consultancies have mentioned that the land cost should ideally not exceed 30% of the total project cost.
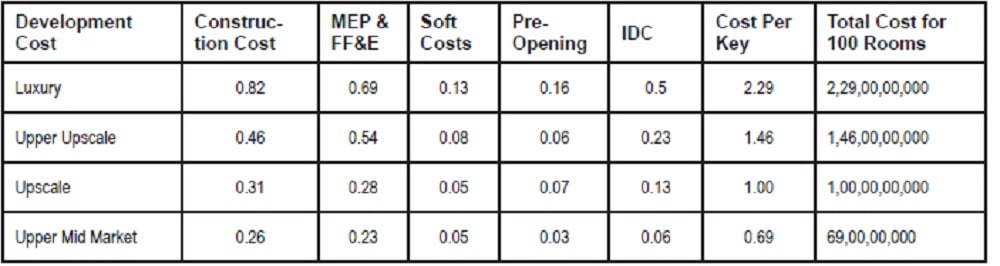
(Source: HVS, 2016)
After 10 years, the owner or developer may seek to exit the project and sell of the asset and yield a return. Peculiar to real estate is a financial term known as Capitalization rate or Cap Rate, which is a ratio calculated by dividing EBITDA by the Value of the Asset stated Thomas (2015). Capitalization rates in more mature economies reported PWC (2017), are typically derived from real transactions that have happened in the market.
The inverse of the ratio is also known as EBITDA multiple shared Quiry et al (2011).
In India due to a lack of transparency and dearth of hotel transactions, capitalization rates are quite limited. Additionally, in the few cases where capitalization rates are available they may not be the best indicators as those.
The assets would have transacted at multiple of almost 20x EBITDA. There is no clear motivation behind some of these transactions. For the given analysis we have assumed a 10x multiple which yield a 10% cap rate.
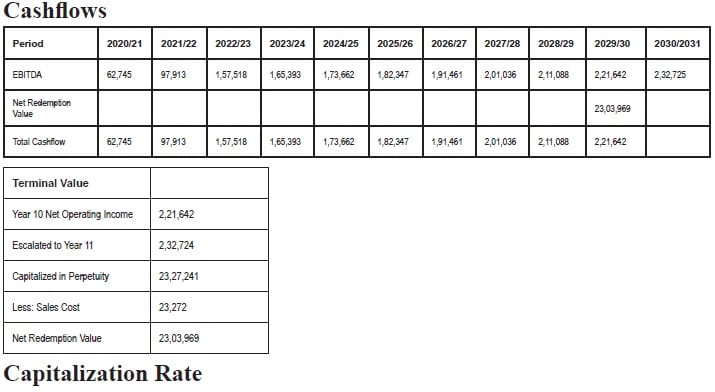
Cap rates are applied to calculate terminal value, which is calculated by dividing the 11th year income by the Cap Rate. In the table above we have escalated EBITDA in the 11th year by inflation of 5% and divided the same by 10%.Thereafter we have deducted sales cost or acquisition costs which we’ve assumed is 1% of the Terminal Value. The difference of the terminal value and the sales cost provides us with the net redemption value.
Terminal Value
The Discounted Cash Flow is considered to be one of the main valuation methodologies for any income earning asset, where the cashflows are discounted to today’s prices. As we typically forecast for a 10 year cycle, a perpetual growth rate or Cap Rate (in the case of real estate) is applied to he next year which immediately follows the last year of projection.
Discount Rate
With having taken a Cap rate of 10%, we can easily derive a Working Average Cost of Capital, which would act as a discount rate for returns to all invested capital.
Capitalization Rate = WACC . Growth Rate (Pratt, 2004)
In our analysis we have assumed that the Growth is 5%, hence as per the above formula we can easily derive the WACC or Discount rate to be 15%.
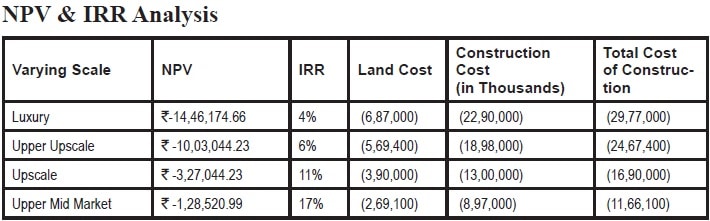
As per the above table, what is interesting to note is that hotels ranging from Luxury to Upscale are largely unfeasible projects, due to the negative NPV’s and poor IRR’s. Additionally the Upper Mid Market product, while feasible is only borderline positive. This is keeping in mind that the above costs are maintained and controlled, as any escalation of the cost would perish the value of the asset under development.
Limitations
The above study is a quick and efficient way for an internal assessment of the value of an investment made by a developer or owner, and is based on high level broad assumptions. However, an investor could look to break up the details of development costs, market performance and operational costs to enhance their accuracy of value and returns.
Conclusion
- Value: One of the most jarring conclusion is in terms of the value an investor could lose investing in a hotel real estate asset. Hotels continue to be the most expensive form of real estate investment, as hotel owners have to invest numerous additions as compared to residential or commercial development. These include furniture, fixtures and equipment, management of the hotel, marketing of the hotel and to maintain a CapEx above all.
- Market Assessment: The above analysis is a great tool for understanding the positioning of the market, given rates and occupancy levels. In the context of Gurgaon an ideal product would be positioned, at the Upper Mid-Market to Mid-Market level and below.
- Asset Management: The above numbers can be seen as testimony for the requirement of good asset management. Revenue Managers and General Managers are required to strategize in terms of value building yielding to the owner.
- Profit Vs Cost Of Capital: Interesting to note is that while the hotel can be seen as profitable, the project could ave a negative NPV due to the cost of capital. This tends to be an anomaly for most owners and hotel management operators, who forget that an investment should bring out value more so, over just simple profits.
- Clocking in on Outlook: Given how dynamic the industry is today compared to 10-15 years ago, it is important for developers to regularly get an outlook of the market, for the sake of maintaining value. Historically, investment in hotels was more about prestige and glamour, they continue to be. However, given the growth in the economy and increasing competition there is a need to revise the curriculum within the industry. Initially hotel management was about service and standards, they continue to be important. However with the sole objective of maximizing returns, it can be a very challenging task.
REFERENCES
Atrill and McLaney (2011) Accounting For Finance For Non Specialists, (7 Edn.), Harlow, FT Prentice Hall.
Burns, P. and Novelli, M. (2007) Tourism and Politics: Global Frameworks and Local Realities, Oxford: Elsevier.
Cushman & Wakefield (2014) e52000 Hotel Rooms Will Be Added In Top Eight Cities By 2017th (online) (cited 4 November 2017). Available from <URL: http://www.cushmanwakefield. co.in/en-gb/news/2014/01/52000-hotel-rooms-will-be-added-in-topeight-cities-by-2017/>.
DeRoos, J. and Rushmore, S. (2017) eHotel Valuation Software 5th, Version 5.0f (online) (cited 4 November 2017). Available from <URL: http://scholarship.sha.cornell.edu/chrtools/14/>.
EY (2014) eReal estate . making Indiaf (online) (cited 4th November 2017). Available from <URL: http://www.ey.com/Publication/vwLUAssets/EY-real-estate-makingindia/$ FILE/EY-real-estate-making-india.pdf>.
FHRAI and HVS (2016) eIndian Hotel Industry Survey 2014-15f (online) (cited 4November 2017). Available from <URL:www.hvs.com/Jump/?f=3763.pdf&c=7586&rt=2>
Goyal, A. and Verma, A. (2017) eSlowdown In Bank Credit Growth: Aggregate Demand Or Bank Non-Performing Assets?, Mumbai: Indira Gandhi Institute of Development
Researchf (online) (cited 4 November 2017). Available from <URL: http://www. igidr.ac.in/pdf/publication/WP-2017-014.pdf>.
Griff, M. (2014) eProfessional Accounting Essays and Assignmentsf (2 Edn.) Lulu Press, Inc. (online) (cited 4 November 2017). Available from <URL: https:// books.google.co.in/books/about/Professional_Accounting_ Essays_and_Assig. html?id=hxhXCAAAQBAJ&redir_esc=y>.
Harris, P. and Mongiollo, M. (2006), Accounting and Financial Management, NY: Butterworth-Heinemann. HFTP Annual Convention (2013) eUniform System of Accounts for the Lodging Industry 11th Revised Editionf (online) (cited 4th November 2017). Available from <URL: http://www.hospa.org/static/cms_page_media/2014/6/6/HOSPA-Finance-Community-USALI.pdf>.
Hospitality Net (2008) eUniform System of Accounts for the Lodging Industryf (online) (cited 4th November 2017). Available from <URL: https://www.hospitalitynet.org/news/4037133.html>.
HVS (2016) eIndia . 2016 Hotel Development Cost Surveyf (online) (cited 4th November 2017). Available from <URL: https://www.hvs.com/article/7852-india-2016-hoteldevelopment-cost-survey>.
HVS (2017) eTrends and Opportunitiesf (online) (cited 4th November 2017). Available from <URL: https://hvs.com/article/8098-2017-Hotels-in-India-Trends-Opportunities>.
Inflation (2016) eInflation India 2016f (online) (cited 4th November 2016). Available from <URL: http://www.inflation.eu/inflation-rates/india/historic-inflation/cpi-inflationindia-2016.aspx>.
JLL (2014) eManagement Contract Trends . A Reviewf (online) (cited 4th November 2017). Available from <URL: http://www.jll.co.in/india/en-gb/Research/2014Sept-Management-Contract-Trends.pdf>.
Joshi, S. (2008) eIT and ITES as an Engine of Growth: An Exploration into the Indian Experience, Delhi: Institute of Economic Growth University of Delhi Enclavef (online) (cited 4th November 2017). Available from <URL: http://www.iegindia.org/upload/publication/Workpap/wp294.pdf>.
Kumar, R. et al (2009) eGlobal Financial Crisis: Impact on Indiafs Poor Some Initial Perspectives (online) (cited 4th November 2017). Available from <URL: http://www.undp.org/content/dam/india/docs/impact_of_the_financial_crisis_on_the_poor_in_
india_some_initial_perspectives.pdf>.
McGinnis, C. (2012) eBusiness Trip: Delhif (online) (cited 4th November 2017). Available from <URL: http://www.bbc.com/travel/story/20121114-business-trip-delhi>
Miller, A. and Hayes, D. (2010) Revenue Management for the Hospitality Industry NJ: John Wiley & Sons.
Ministry of Finance, Government of India (2011) eEconomic Survey . Chapter 10: Service
Sector (online) (cited 4th November 2017). Available from <URL: http://indiabudget. nic.in/budget2011-2012/es2010-11/echap-10.pdf>.
Ministry of Finance, Government of India (2016) eEconomic Survey . Volume IIf (online) (cited 4th November 2017). Available from <URL: http://www.thehindu.com/migration_catalog/article14052852.ece/BINARY/Economic%20Survey%20-%20 Volume%202>.
Moore, H. L. (1925) A Moving Equilibrium of Demand and Supply, The Quarterly Journal of Economics, 39:3, pp. 357.371. Munjal, S. and Bhushan, S. (2017) The Indian Hospitality Industry: Dynamics and Future Trends, NJ: Apple Academic Press, Inc.
Musonera, E. and Ndagijimana, U. (2016) eAn Examination of Factors that Affect Pricing Decisions for Export Markets (online) (Cited 31st March 2017). Available from <URL: http://www.jgbm.org/page/22%20Etienne%20Musonera%20.pdf>.
O’Neill, J. (2011), Hotel Occupancy: Is the Three Year Stabilization Assumption Justified? Cornell Hospitality Quarterly, 52:2, pp. 176-180.
Pratt, S. (2004) Business Valuation Body of Knowledge (2nd edn.), NJ: John Wiley & Sons. PwC (2016) eIndiafs new real estate and infrastructure trusts: The way forwardf (online) (cited 4th November 2017). Available from <URL: https://www.pwc.com/sg/en/publications/assets/aprea-in-realestate-infra-trusts.pdf>.
PwC (2017) eEmerging Trends in Real Estatef, (online) (cited 4th November 2017). Available from <URL: https://www.pwchk.com/en/real-estate/ap-real-estate-trends-2017. pdf>.
Quiry, P. et al (2011) Corporate Finance: Theory and Practice, (3rded.), Sussex: John Wiley & Sons.
Singh, J. (2015) eThe growing non-performing asset problem in Indian banks: An intervention plan, (online) (cited 4 November 2017). Available from <URL: https://www.indiainfoline. com/article/news-top-story/the-growing-non-performing-asset-problemin-indian-banks-an-intervention-plan-115071500530_1.html>
Srivastava, N. and Maitra, R. (2016) Key Performance Indicators (KPI) in Hospitality Industry: An Emphasis on Accommodation Business of 5 Star Hotels of National Capital Region, International Journal of Research in Tourism and Hospitality, 2:1, pp. 34-14.
Taneja, G. (2016) eSmall cities are Indiafs emerging business locationsf (online) (cited 4th November 2016). Available from <URL: http://www.forbesindia.com/blog/economypolicy/ small-cities-are-indias-emerging-business-locations/>.
Thomas, B. (2015) eUnderstanding Cap Rates: The Answer is 9f (online) (cited 4th November 2017). Available from <URL: https://www.forbes.com/sites/bradthomas/ 2015/04/22/understanding-cap-rates-the-answer-is-nine/#7ffb6c585c32>.
Sasha Menon, Manager, Epitome, DLF Cyber City, Gurugram, India. Email: sashamenon@gmail.com
Sameeksha Goyal is currently working as an analyst with Horwarth HTL India. Horwath HTL is the hospitality consulting brand of Crowe Horwath International.
Email: sameeksha.goyal@gmail.com.
Recent Comments